Nepal: Assessing Conditions and Trends
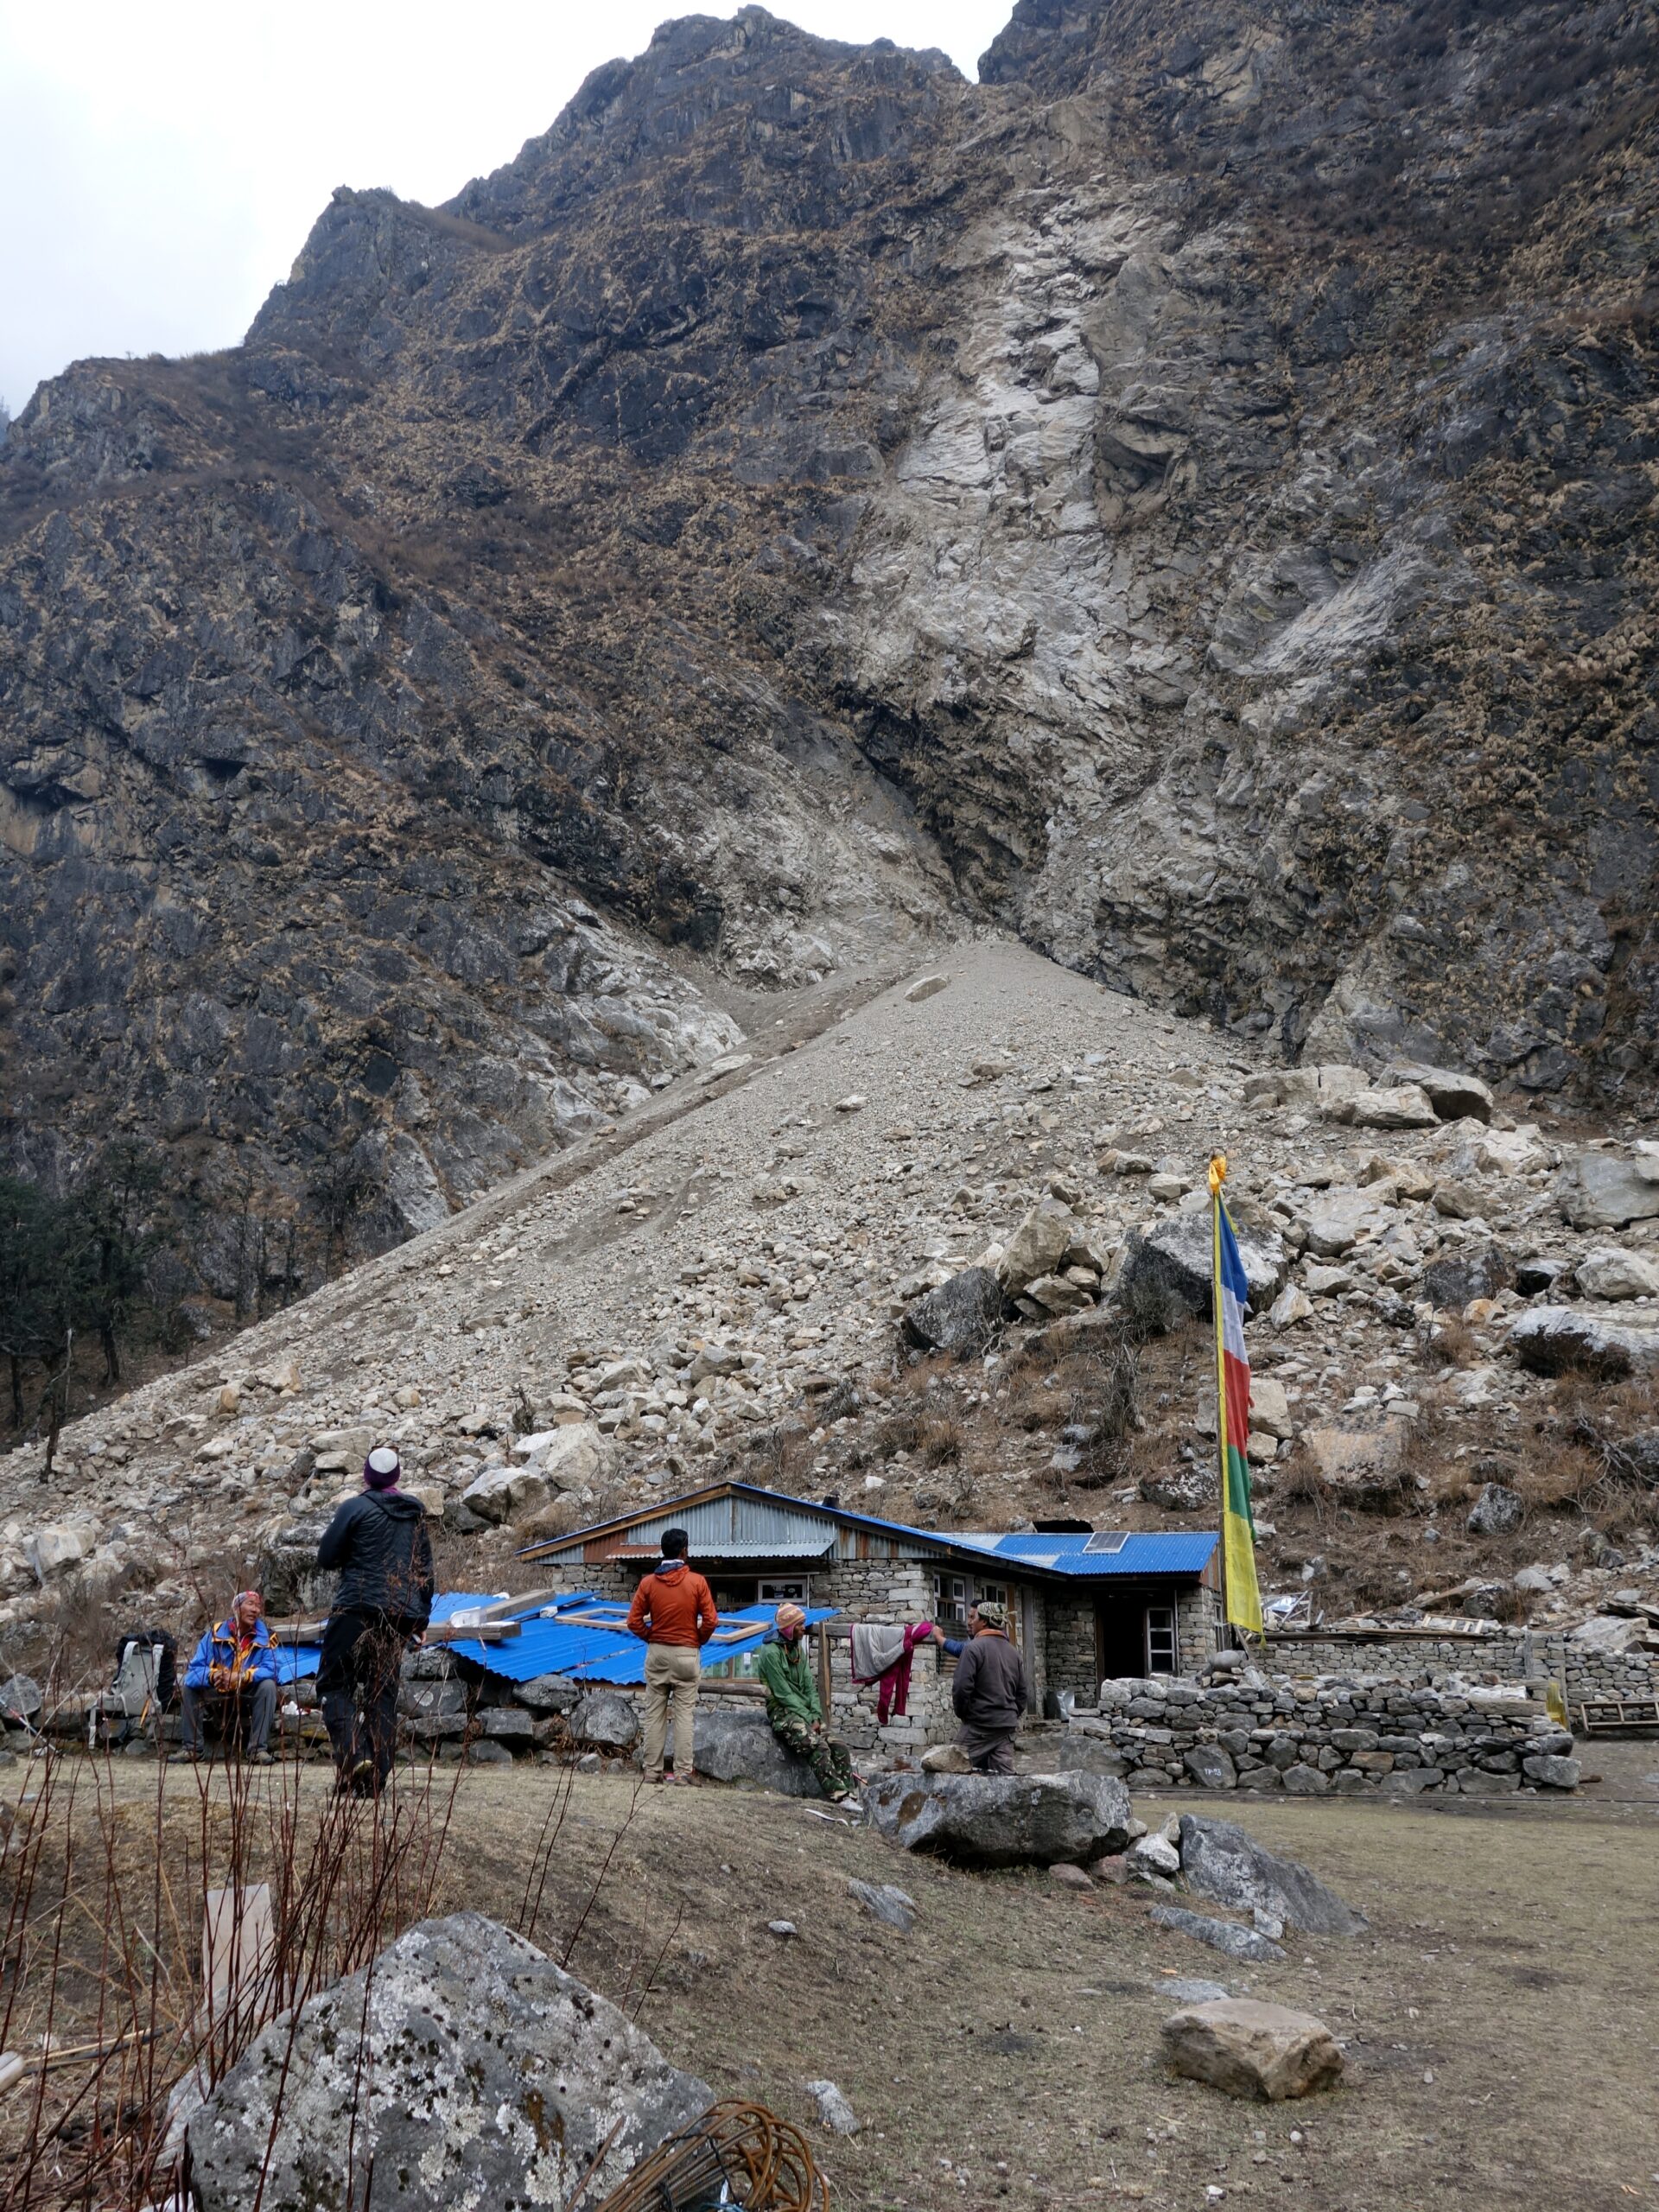
Highlighting the location of specific hotspots in the country where climate-related hazards are experienced or likely to be felt is a key step in identifying intervention areas. The initial screening process begins with this question, which allows the user to reframe the climate change problem in the context of local conditions/constraints and opportunities. This can show whether climate change impacts are likely to be material for a particular development function, activity or service. Isolating these locations for further examination is a critical starting point. Further analysis of the trends and impacts of these hazards, when combined with key vulnerability indicators will help to narrow down priority zones for specific project targets- namely the community groups in Putalibazaar Municipality.
The spectrum of hazard risk affecting households and an agency’s ability to respond to hazards can be broadly placed under two categories: 1) the biophysical and social context, which encompass terrain characteristics, climate, infrastructure availability, demography and other measurable attributes of a landscape and that shape a household or community’s vulnerability to specific hazards, and 2) culture, perspectives and the changing dynamics of a household or community’s situation that influence their resilience in the face of hazards, which are difficult to measure and often quite context-specific.
Biophysical and social context
Those maps shown here that fall into the first category include climate. They show the long term mean maximum temperature, annual precipitation, annual precipitation divided by potential evapotranspiration and trigger precipitation (for the three months which start when precip/PET is greater than 0.5).
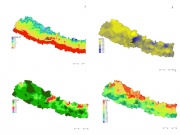
Mean climate maps : mean max temperature, annual precipitation, annual precipitation/PET and trigger precipitation (for three months which starts when p/pet is >0.5)
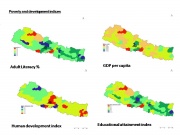
Poverty and development indices
Culture, perspectives and the changing dynamics of a household or community
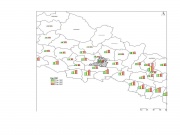
The total population of Nepal is estimated as being 23,151,423 persons, of which 11,563,921 (49.95%) are male and 11,587,502 (50.05%) female. The overall population growth rate is 2.24% per annum (NLSS 2004) this can be seen in the figures as populaion increase in all districts. When comparing the population distribution among agro-ecological belts, the Terai has the highest percentage of population, nearly half at 48%, followed by the Hill with 44% of the population. The remaining eight percent are located in the Mountains. Across regions, the Central region has highest population (35%), followed by the Eastern (23%) and Western (20%). The Mid Western and Far Western regions have relatively low populations of 13% and 9% respectively.
Migration is a complex issue in Nepal and it is used in times of food insecurity when crops have been damaged following a flood or landslide.This further information on migration based on a survey of 1700 households in 43 districts comes from the Nepal – Comprehensive Food security and Vulnerability Analysis (CFSVA) – 2005.
The most common destination for migrants was reported to be India (39% of households having one or more members there). Internal migration in Nepal was the second most common destination (38%). And finally, 32% of households reported that they had migrating members in countries outside of the sub-continent, especially Saudi Arabia, Qatar, Malaysia and Dubai (in that order of priority).
Ninety-six percent (96%) of all sampled communities reported that residents migrate at one or more points in the year to look for work. The most common period of time is between November and April reported by 57% of sampled communities and 13% indicated July-September. However, almost 30% of the communities reported that residents migrate year-round.
Seventy percent of all key informant interviews indicated that non-agricultural wage labour presumably in the service sector was the main type of work that migrants seek when leaving the community. This is followed by agricultural wage labour (12%), income generating activities (10%), and finally government employment (8%). Lastly, 66% percent of all sampled communities reported that people between the ages of 20-29 years represent the main group migrating from their communities in search of work.
The median annual remittance to households with a member migrating to another location in Nepal is NRs. 12,000 (approximately USD164), in India NRs. 10,000 (USD137) and in the Middle East (e.g., Saudi Arabia) and other areas NRs. 60,000 (USD822). Households in the Hill belt reported the highest frequency of migrating members. When looking at these figures in the context of access to agricultural land in this same belt, the monetary incentives to migrate become more apparent. Roughly half of households in the Hills do not have access to land and those that do have access to land have on average landholdings smaller than the average (i.e., < 0.6 ha). The data also show that most migrants are men between the ages of 18 and 30. This group would tend to be the most economically productive household members and those most likely to engage in agriculture if it were a viable option. Migration is a complex issue which this survey only begins to explore. Factors, such as under- and unemployment are likely to contribute to its upward trend. The same might apply to the intensification of hostile activities by the parties to the armed conflict, the impact of which is hard to quantify. High migration rates could exert particular negative or positive influence upon the social fabric in rural areas. This requires further research.
Background to ACCCA Nepal Project
Background on Disasters in Nepal
Nepal Vulnerability Assessment
Identifying Climatic Hazards in Nepal
Understanding trends in climate in Nepal
Other work on Adaptation in Nepal:
Practical Action: Promoting Adaptation in Nepal
Population by District from surveys 1981, 1991 and 2001
Culture, perspectives and the changing dynamics of a household or community
The total population of Nepal is estimated as being 23,151,423 persons, of which 11,563,921 (49.95%) are male and 11,587,502 (50.05%) female. The overall population growth rate is 2.24% per annum (NLSS 2004) this can be seen in the figures as populaion increase in all districts. When comparing the population distribution among agro-ecological belts, the Terai has the highest percentage of population, nearly half at 48%, followed by the Hill with 44% of the population. The remaining eight percent are located in the Mountains. Across regions, the Central region has highest population (35%), followed by the Eastern (23%) and Western (20%). The Mid Western and Far Western regions have relatively low populations of 13% and 9% respectively.
Migration is a complex issue in Nepal and it is used in times of food insecurity when crops have been damaged following a flood or landslide.This further information on migration based on a survey of 1700 households in 43 districts comes from the Nepal – Comprehensive Food security and Vulnerability Analysis (CFSVA) – 2005.
The most common destination for migrants was reported to be India (39% of households having one or more members there). Internal migration in Nepal was the second most common destination (38%). And finally, 32% of households reported that they had migrating members in countries outside of the sub-continent, especially Saudi Arabia, Qatar, Malaysia and Dubai (in that order of priority).
Ninety-six percent (96%) of all sampled communities reported that residents migrate at one or more points in the year to look for work. The most common period of time is between November and April reported by 57% of sampled communities and 13% indicated July-September. However, almost 30% of the communities reported that residents migrate year-round.
Seventy percent of all key informant interviews indicated that non-agricultural wage labour presumably in the service sector was the main type of work that migrants seek when leaving the community. This is followed by agricultural wage labour (12%), income generating activities (10%), and finally government employment (8%). Lastly, 66% percent of all sampled communities reported that people between the ages of 20-29 years represent the main group migrating from their communities in search of work.
The median annual remittance to households with a member migrating to another location in Nepal is NRs. 12,000 (approximately USD164), in India NRs. 10,000 (USD137) and in the Middle East (e.g., Saudi Arabia) and other areas NRs. 60,000 (USD822). Households in the Hill belt reported the highest frequency of migrating members. When looking at these figures in the context of access to agricultural land in this same belt, the monetary incentives to migrate become more apparent. Roughly half of households in the Hills do not have access to land and those that do have access to land have on average landholdings smaller than the average (i.e., < 0.6 ha). The data also show that most migrants are men between the ages of 18 and 30. This group would tend to be the most economically productive household members and those most likely to engage in agriculture if it were a viable option. Migration is a complex issue which this survey only begins to explore. Factors, such as under- and unemployment are likely to contribute to its upward trend. The same might apply to the intensification of hostile activities by the parties to the armed conflict, the impact of which is hard to quantify. High migration rates could exert particular negative or positive influence upon the social fabric in rural areas. This requires further research.
Background to ACCCA Nepal Project
Background on Disasters in Nepal
Nepal Vulnerability Assessment
Identifying Climatic Hazards in Nepal
Understanding trends in climate in Nepal
Other work on Adaptation in Nepal:
(0) Comments
There is no content