data visualization
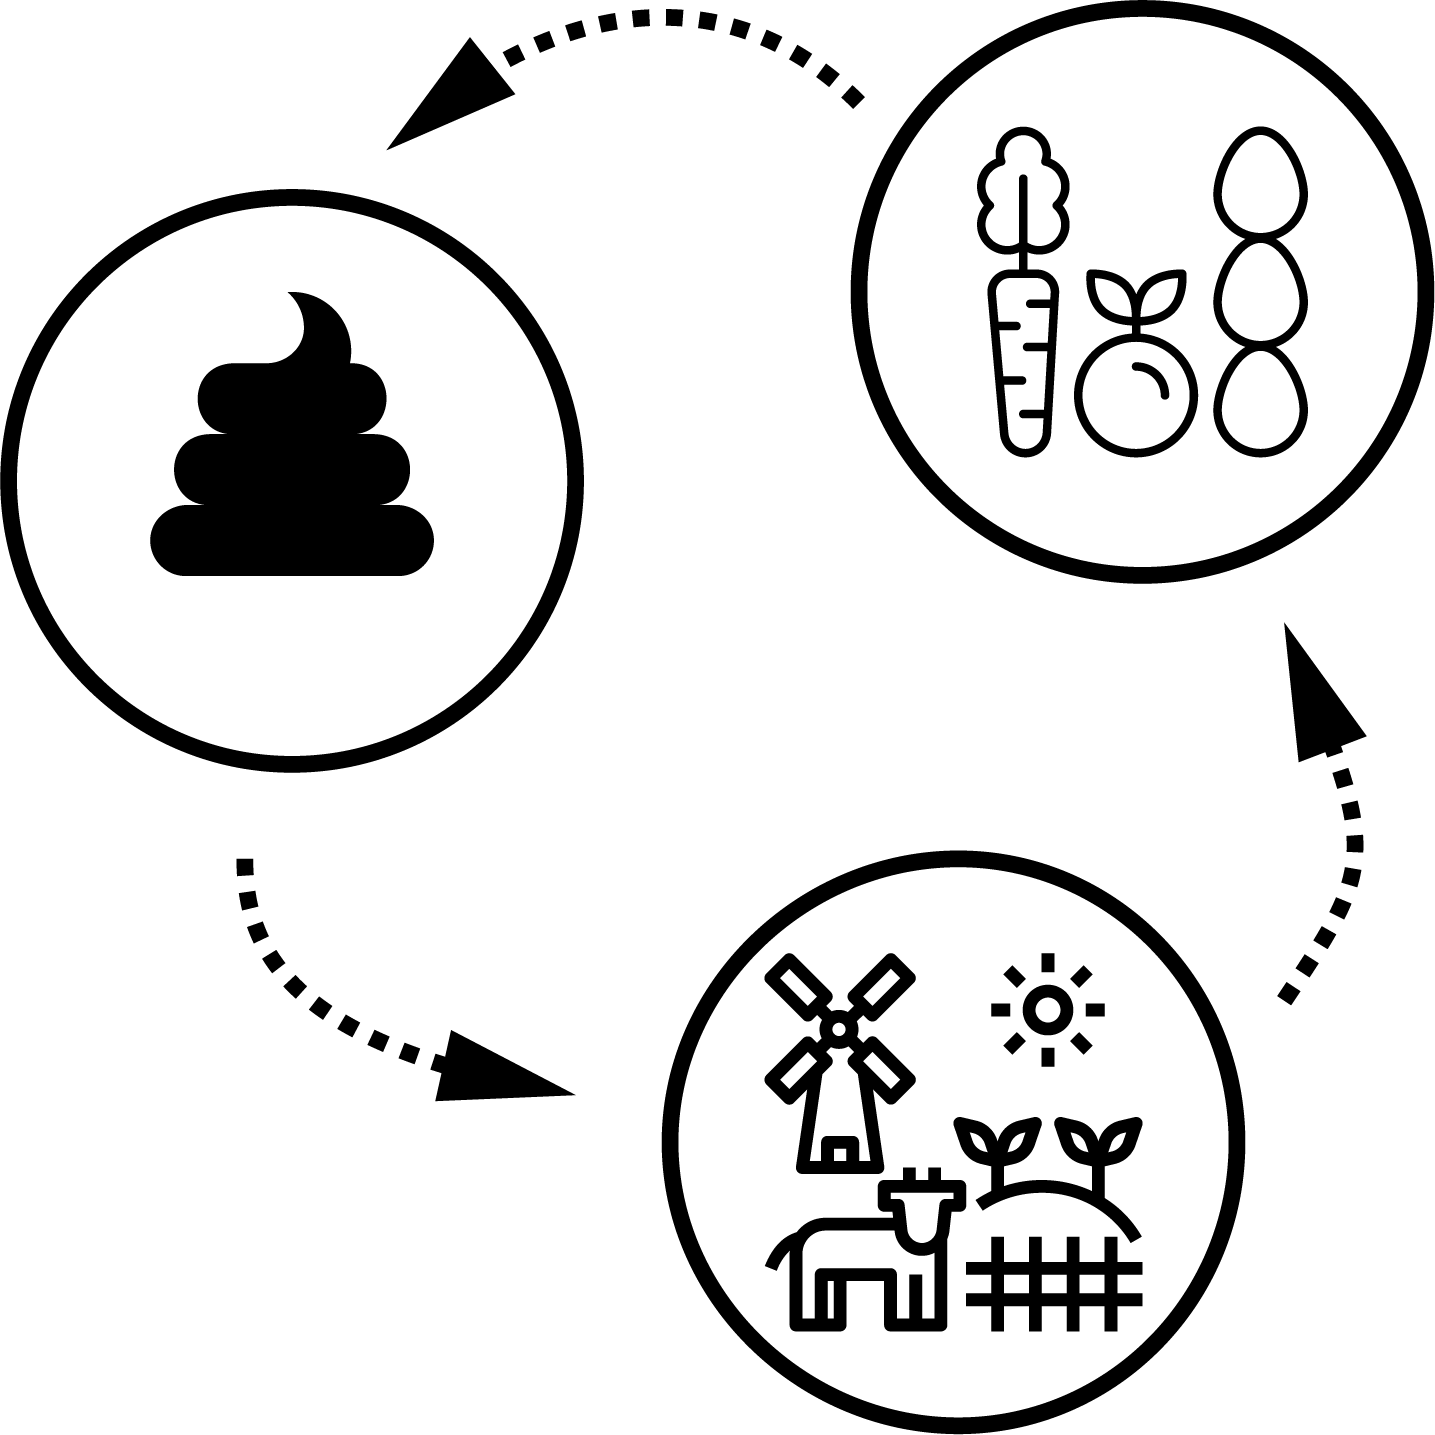
EGESTABASE Tool
Learn about EGESTABASE, an emerging online platform that aims to comprehensively map scientific evidence on the recovery of nutrients from human excreta and municipal wastewater for reuse in agriculture. The online platform helps you discover different innovative approaches and studies that exist, and use this evidence to inform decision-making processes.
Digitalization of the built environment: Towards a more sustainable construction sector
Digitalization opens up new opportunities to contribute to the achievement of the Paris Agreement targets and the 2030 Agenda and its Sustainable Development Goals (SDGs). The SDC-supported Climate Ledger Initiative (CLI) is helping to achieve the Agreement’s climate targets using digital ledger technologies such as blockchain and other distributed ledger technologies. These offer huge potential for climate action.
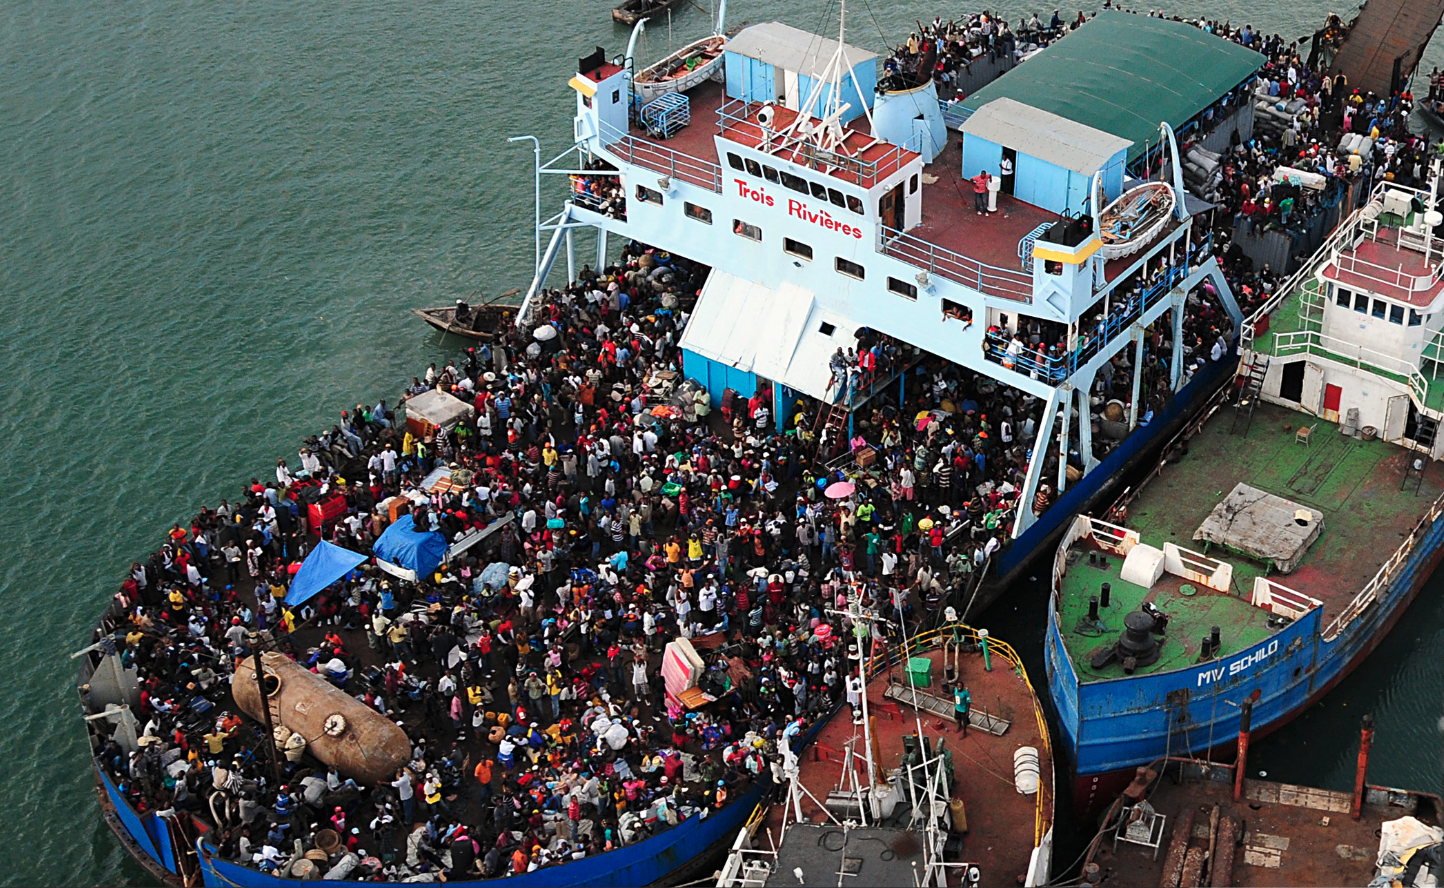
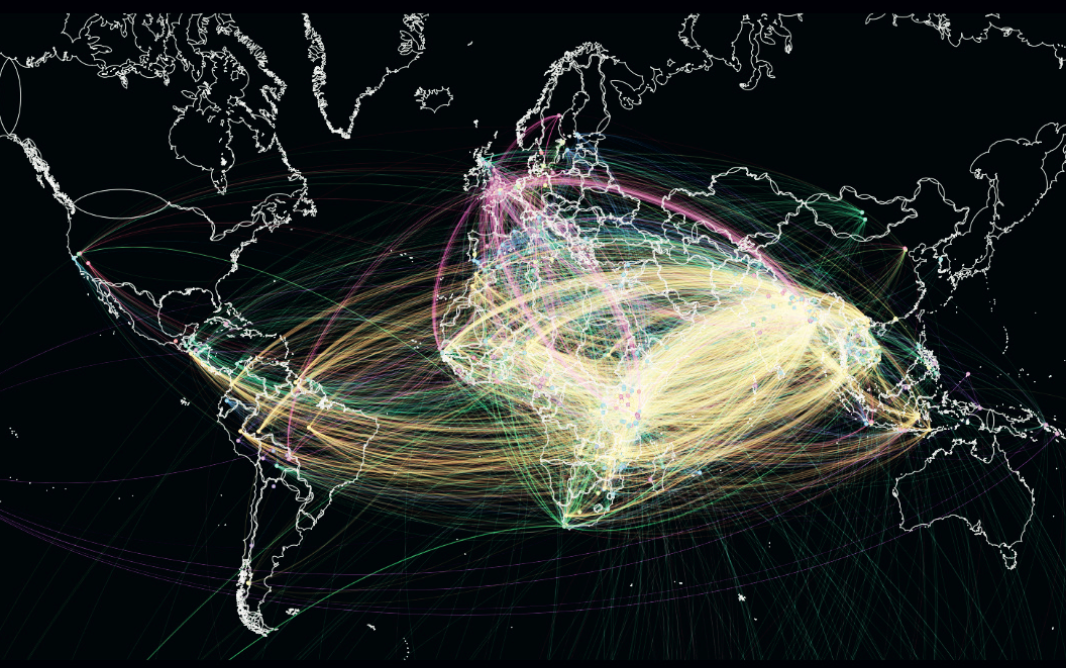
Inescapably intertwined: the reality of globalisation and borderless climate risks
Climate adaptation efforts are unlikely to succeed if done in geographic isolation. The Transnational Climate Impacts Index examines country exposure to climate change from an international view.
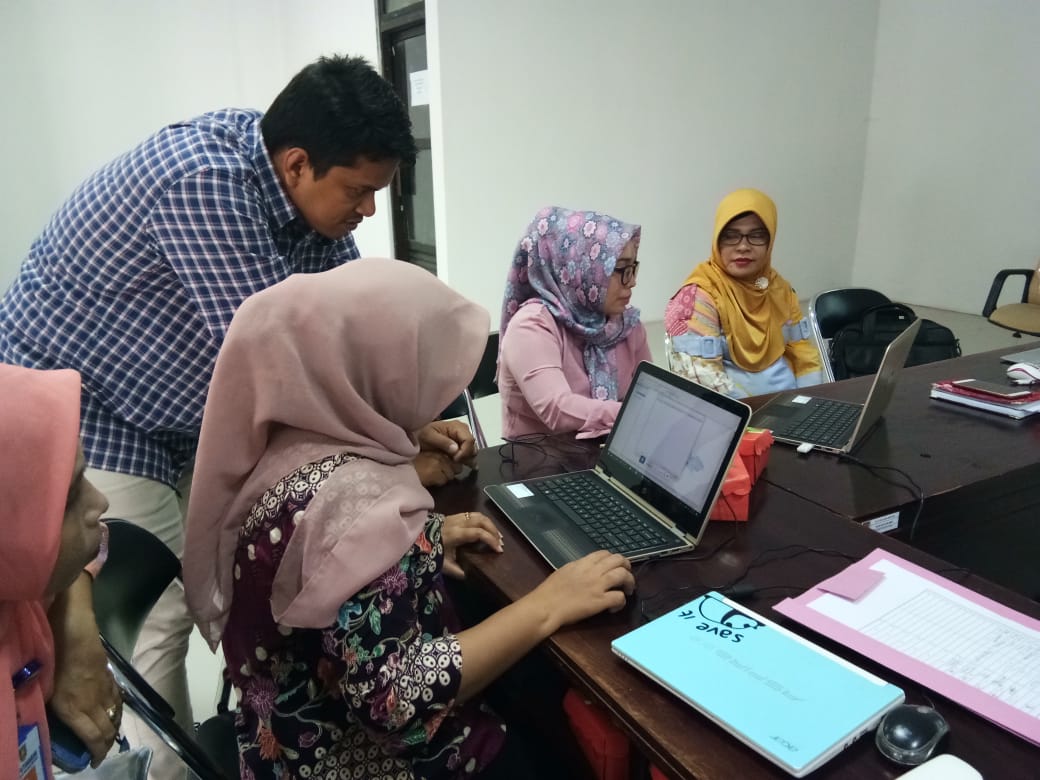
Using GIS for disease mapping in Ambon City
Adaptation plans for the health sector required public access to data about malaria and dengue risk but staff lacked mapping skills. Training in GIS mapping proved successful in Ambon City
Visualizing connections: Mapping the landscape of adaptation research and practice through weADAPT
This working paper describes a collaborative project to visually map climate change adaptation research and networks based on semantic tagging in weADAPT.