Infographics
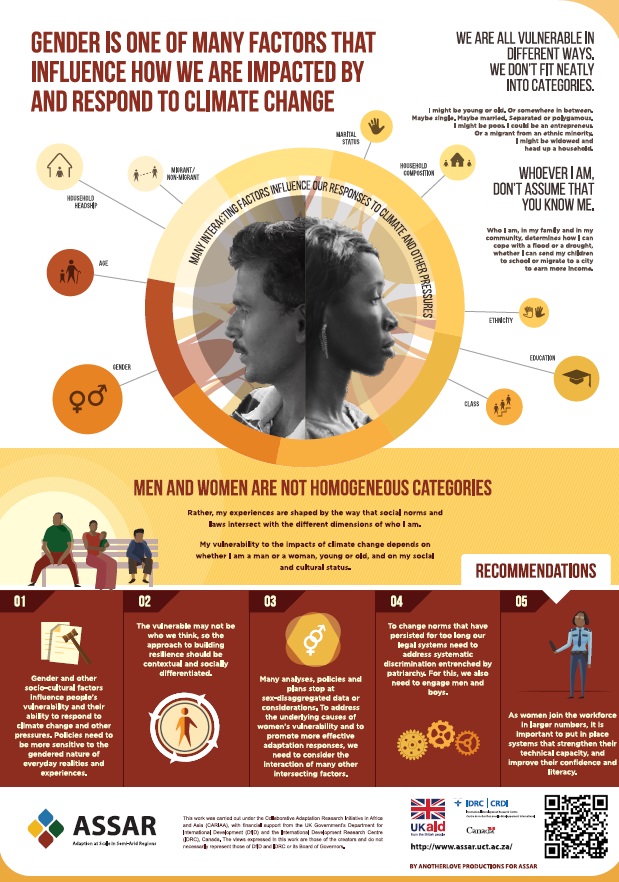
Gender Infographics: Showing how gender influences responses to risk
How people experience and respond to risk varies, depending on factors like age, ethnicity, gender and class. These stunning infographics offer an easy-to-understand overview.
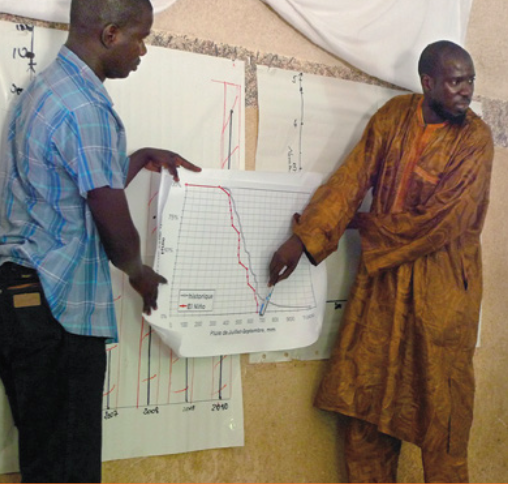
How to understand and interpret global climate model results
Guide targeted at decision-makers to enable them to interpret the various plots, graphs and maps that are used to present global climate model projections.
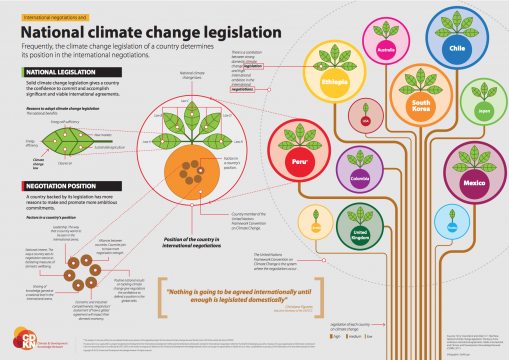
Infographic for communicators: National Climate Change Legislation
CDKN has launched a new infographic that illustrates the connections between countries’ domestic laws on climate change and their ambition in global climate talks.

Stakeholder Identification Exercises
Learn about useful exercises for identifying stakeholders that have a legitimate stake in the outcome of a decision or project.