Mapping of social networks as a measure of social resilience of agents

Introduction
The capacity of social network maps as a multi-purpose heuristic device is very useful – indeed necessary – if we want to explore ideas of community resilience and planning in the face of natural disasters. As White (1945) put it, if “floods are ‘acts of God’, flood losses are largely acts of man” and therefore being able to present a formalized, structured understanding of social aspects (“the social”) is critical to understanding, communicating, and providing truly integrative research on what community resilience to multiple hazards actually means in practice. Resilience cannot be left to hydrologists and physical planners alone, it must include the social.
Our social network maps provide such a model of the links between significant individuals involved in key stages of the disaster planning, response and recovery phases. Further, they do so in a structured manner which allows this necessary social data to be communicated across disciplinary divides and also to be located within the context of a wider conceptual framework that links (social) knowledge networks and (institutional) decision-making structures. As a result, better decisions may be made.
This report describes the process and application of the theory of social networks to disaster risk management, and explores the application of social network visualisation and mapping as a measure of community resilience following natural disasters. At the core of this report are two emBRACE case studies where SNM inspired methods were applied. These are Alpine Hazards in South Tyrol, Italy (emBRACE, 2014a) and Floods in Northern England (emBRACE, 2014b).
The full report can be downloaded from the right-hand column or via the link under further resources. The text below is heavily abridged.
Background: Social Network Mapping
There is a growing literature that suggests that social networks play a critical role in resilience to disasters (Aldrich 2012, Beilin et al. 2013, Hawkins and Maurer 2010, López-Marrero and Tschakert 2011, Tobin et al. 2014). Social networks can help, particularly in assessing how the network topology (structure, i.e., defined as specific patterns of connections between network actors, called ‘nodes’ in network terminology) and dynamics (processes, i.e., interactions among the nodes over time and space) influence the nature and level of resilience in a community. Further they can help identify barriers or structural holes in effective communication among actors; highlight aspects of power imbalances; and, provide a multi-actor multi-scalar view of interrelationships within and among communities.
The qualities that make communities resilient can be seen as emanating from unique abilities – inherent or learned – that a community embodies (Barrios 2014). Social network mapping allows us to capture that embodiment. Resilience to natural disasters was at one stage largely left to be a domain of hydrologists, seismologists, geologists, volcanologists, engineers and physical planners. Recent scholarship has challenged this notion and asserts that practices and structures of political and economic relationships, as manifested through social networks, are critical to resilience study. Capturing the structure of social relationships, and mapping them in time and space, contributes to our understanding of how community resilience emerges (cf. Barrios 2014: 330).
Structured maps are necessary for understanding and comparing relationships across the levels of governance and across scales of community. Traditional social science methods have on occasions fallen into the practical fieldwork-generated trap of focussing on one scale of community alone. This is unhelpful for understanding what community resilience is, or how it can be facilitated, for the emergent property of community resilience is certainly the produce of cross-scale social relationships that allow communities at local levels to become resilient (or not). The creation of community resilience can be seen as a social capital embodied in the quality of the relationships between people: and this relationship between people can be measured by network mapping.
Lessons Learnt
- These case studies evidence how bonding, bridging and linking ties in social networks have provided resource flows and assistance in the aftermath of disasters. These ties were important in sharing of diverse knowledge and skills, and for acting together when the crises hit. Overall the studies show that the density and diversity of relationships enabled the provision of a range of resources, including, emotional, physical and financial support, which were crucial to building and maintaining resilience.
- Horizontal and vertical ties helped the communities with the acquisition of local support and national resources from higher level government circles.
- Theoretically speaking, the social networks that emerged from our case studies, show traits of a number of characteristics that are currently discussed among network researchers. They include notions of complexity, dynamism, adaptation, and coupling with larger and distant networks. These characteristics allow us a powerful insight into explaining how our social networks function, and how complex, adaptive and stable such networks need to be to enhance community resilience. One critical point that emerged from this discussion is that one cannot understand the network-of-interest without understanding the broader context within which this network operates.
- Findings from our case studies show that participatory approaches to network analysis based on a combination of narratives, interviews and surveys can address some methodological concerns described in the network literature to a significant extent. These combined methods can enable the networks to enlist nodes across multiple boundaries, qualify the ties and constantly re-work them, and define the time scale in which the processes of interest unfold. Networks co-created in this way can, at least, have practical relevance in providing a space for blending of scientific facts with individual experiences, values and emotions.
- Network maps and visualisations, particularly when co-created by the users themselves, can be used to understand mechanisms through which the indicators of community resilience can be portrayed. Most important among the indicators are density and diversity of nodes, dynamism and modularity of network structure, and redundancy of ties. Together they allow analysis of the nature and level of community resilience, and can be an important channel in linking local communities to policy makers and knowledge brokers at multiple levels.
- Maps are a powerful tool for structuring knowledge of a range of actors on what makes them resilient, and communicating this knowledge to other actors in other positions in space and time.
Examples from the report
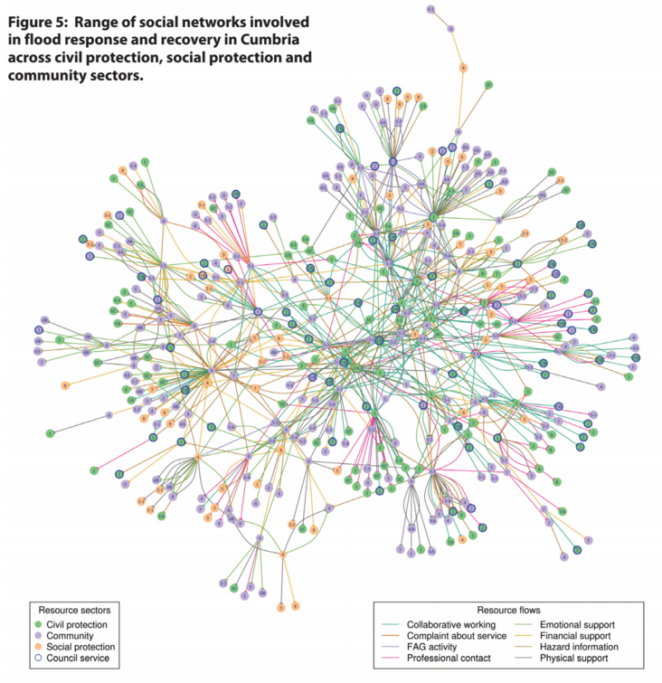
Figure 5*, below, from the emBRACE Case study in Cumbria, found that resources from a diverse range of sectors are important for community resilience. These were classified into civil protection (e.g. emergency services), social protection (e.g. health, wellbeing, insurance and legal protection) and community sector (e.g. Flood Action groups and local sources of support). *In the Local Stakeholder Briefing note available under further resources; in the main report this is Figure 9, from page 43.

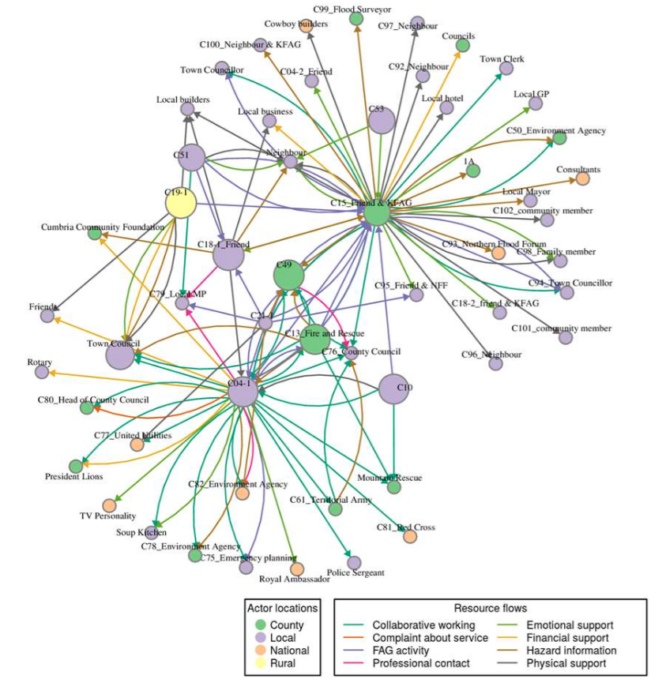
Figure 8 below, an example from the case study looking at flooding in NE England, shows how influence can be greatly enhanced when two networks merge (in this case two individuals from the Keswick Flood Action Group). Such illustrations suggest why brining together a group of 10 or or individuals in an organised community group can be a powerful tool.

Suggested citation
Matin, N., Taylor, R., Forrester, J. M., Pedoth, L., Davis, B., Deeming, H., & Fordham, M. (2015). Report: Mapping of social networks as a measure of social resilience of agents. CRED, Louvain , (60pp).
Related resources
- View this report online
- The emBRACE project
- Go to the emBRACE project website
- emBRACE case study: Floods in Northern England
- emBRACE case study: Alpine Hazards in South Tyrol, Italy
- emBRACE highlights: Google Earth Flyover for Northern England
- Local Stakeholder Group (LSG) Briefing Note – Cumbria
- View more outputs from the emBRACE project
- Go to the emBRACE Handbook
- Go to: emBRACE Teaching and Training Materials
- Social network mapping (method description)
(0) Comments
There is no content