Climate Change and Water Resources in the Huong River Basin
For the assessment of the potential climate change impacts on water resources, different modeling methods were used, including MIKE11 and MIKEBASIN. The input data that was used included meteorological data (daily maximum and minimum air temperatures, precipitation from 1961 to 2004) and their projections for 2010 to 2100 according to various scenarios. Potential evapo-transpiration (ETo) data was calculated for the baseline year 1990 and for the periods 2020 to 2049 and 2071 to 2100 at A Luoi and Hue stations using the Thornthwaite’s formula.
Climate change impacts on river runoff
For the calculation of runoff flow caused by rainfall in the basin, the Rainfall-runoff (NAM) model was used. When rainfall, rain distribution and rain amount lost by evapo-transpiration and temperature increase changes, the runoff and discharge will also change.
Figure 8 shows the observed and projected monthly flow at Co Bi gauging station for the periods 1977 to 2006, 2020 to 2049 and 2071 to 2100 under the B2 emission scenario. The trend line shows a very small increase in the river flow. Figure 7 further shows the changes in average annual runoff for four different gauging stations for the same periods. As can be seen from this figure, increases in average annual runoff are projected for all stations. For example, the computational results under scenario B2 at Co Bi gauging station are shown in Figure 8. For each of the sub-basins, the change in average annual runoff was also calculated (Figure 7).
Flood mapping
Based on the MIKE 11 outputs, MIKE 11 GIS was used to interpolate the water levels at all cross-sections in order to construct a grid-based (TIN-based) water surface. The water surface was then automatically compared with a Digital Elevation Model (DEM) to produce and calculate flood depth maps. The flood depth maps were produced for the different emission scenarios and for different areas in the province.
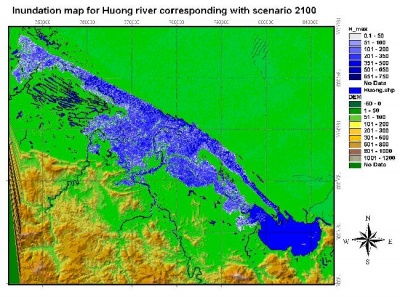
Figure 9 below shows two graphs depicting the changes in flooded areas according to the B2 and A1F1 emission scenarios. As can be seen from the diagrams, both emission scenarios will result in an increase of the inundated areas in Phu Vang district. Figure 10 shows an example of a flood map for the Huong River Basin corresponding with Hmax for the B2 scenario.

Figure 9:Change in the extent of inundation in Phu Vang district in years corresponding with different scenarios

Figure 10:Inundation map corresponding with the year 2100
Impact of climate change on salinity intrusion
The HD and AD modules of MIKE 11 have been used to estimate the salt profile, after proper calibration and verification. Scenarios for salinity intrusion simulation were developed based on the projected change in sea level as described above. The year 2002 was selected as the baseline reference because the observed data from this year was the most complete of that available. Results of salinity intrusion computation for selected scenarios are shown for some cross-sections in the main rivers. The computational results show that there will be an increase in salt concentration as time passes in correlation with sea level rise. Table 8 shows the computation results of the increase in salt concentration in one location along the Huong River.
The results of salinity intrusion as calculated by the model clearly show that due to the effect of sea level rise and water shortage, increase in use during the dry seasons, the salinity of most rivers in the Huong River system will increase considerably. Therefore, further anti-saline measures will be required, notwithstanding existing infrastructure developments.
Netherlands Climate Assistance Programme (NCAP)
Methodology of Vietnam NCAP Project
(0) Comments
There is no content