Overview of Climate Change in Kenya
Current Climate and Hazards

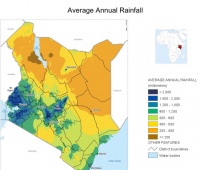
Kenya has a dipole rainy season in which the long rains are generally from March to May as the ITCZ moves northwards, and the short rains are typically from October to December as the ITCZ retreats southwards. There is significant inter-annual and spatial variation in the strength and timing of these rains. Rainfall varies from over 2000mm/year in some areas to less than 300mm/year in the arid northern areas. Drought and floods are the major climatic hazards in Kenya, with a estimated 23 million people affected by widespread drought in 1999. El Niño also has a large effect on climate in Kenya, intensifying rainfall and causing flooding. The cost of the 1997/98 El Niño to the agriculture sector alone was estimated at $236m ([1])
Baseline Vulnerability data for Kenya

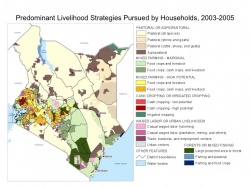
There are a wealth of datasets available for Kenya which cover everything from basic climatology to ecosystems, to livelihood strategies and demographics, and can be used to build up a picture of the baseline vulnerability in the country.
Climate Trends
Results from recent work from stations in Kenya and Tanzania, indicate that since 1905, and even recently, the trend of daily maximum temperature is not significantly different from zero. However, daily minimum temperature results suggest an accelerating temperature rise. (Christy, J.R. W.B. Norris, and R.T. McNider, 2009: Surface Temperature Variations in East Africa and Possible Causes. J. Climate, in press).
In the observed, gridded, gauge data sets over the period 1901-2000 or over 1951-2000, there are no homogenous, statistically significant trends (0.05% level of probability) towards wetter or drier climates in East Africa. In the Short rains, there is a discernible pattern of northern Kenya becoming wetter while southern Kenya and Tanzania is becoming drier in the 1951-2000 analysis, although these patterns are not strong enough to be regarded as not due to chance (i.e. they are not statistically significant).
Climate Projections for Kenya
Average temperatures in Kenya are likely to increase in the range of 1-3C by the 2050s according to downscaled results from 8 climate models using the climate change explorer tool, and maximum temperatures show similar changes. The greatest warming generally occurs from July to September.

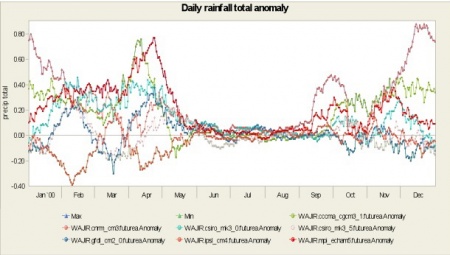
Daily rainfall anomaly for the period 2046-2065 at Wajir
Using the the climate change explorer we can use downscaled climate projections from the University of Cape Town to explore climate projections at the station level in Kenya. Taking the station of Wajir in northern Kenya as an example we can start to dig in detail into where there is model agreement, and where is more uncertainty over projected changes. Exploring the uncertainty in the climate models allows us to start making informed decisions. In the case below IIED have been working with pastoralist communities in northern Kenya, and the questions that were most important for these communities were:
- What changes will there be to the onset of the rainy season?
- How will the intensity of rainfall change?
- Will there be a change in the frequency and length of dry-spells?
Changes to the rainy season
The long rains in Wajir begin late March and last until early June, and the short rains occur from Oct-Dec. A majority of the models (5/7) available show an increase in precipitation during March, and throughout April and May, with a particularly strong signal (6/7) during the peak rainy season from mid-April to early May. Without thresholds for calculating a ‘useful start’ to the rainy season it is difficult to say what the effect of increases in March would be, although there does appear to be a tendency towards earlier rains, or at least slightly more relief during the dry season. A stronger end to the first rainy season also appears likely.
During September, October and the first half of November a majority of models (at least 5/7) show increased rainfall, whereas the pattern for the December and January is less clear, with models in disagreement about increases or decreases in precipitation. The increase in rainfall shown at the in September and October may indicate a tendency for an earlier start to the rainy season, however, in this respect it is important to note that the magnitude of the changes in these months ranges from very small changes (around +0.05mm/day) which would certainly not indicate early rains, to +0.50mm, which would have a significant effect the timing of the rains. Calculating thresholds of rainfall above which it can be said ‘useful rains’ have started would help to clarify the situation, as one could look at the timing of when models cross that threshold.
Very little can be said from the models about changes to the end of the short rains at Wajir.
Intensity
The intensity of rainfall, and extreme rainfall events is expected to increase in Wajir. The intensity increase is most robust for April, where all indicators of intensity indicate increases, but is also expected to increase during the short rains. Interestingly, the number of heavy rainfall events (greater than the current 90th percentile) in March is also expected to increase, which may reinforce the suggestion of a stronger start to the rains.
All models point to shorter average duration of dryspells in April and September, and 5/7 to shorter dryspells in February and March.
Temperature
There is much more agreement between models over changes in temperature. The range of change in the highest maximum monthly temperatures is of +1.2-3C, and the same for average maximum monthly temperatures. The greatest average maximum increases occur in May and June, and the greatest highest maximum temperatures from Jun-Sep. The smallest increases are projected occur in December and January.
Regional climate model- RegCM3 Results from the North Carolina State University enhanced version of the RegCM3 regional model (Anyah et al 2006 ab) which has been run for both a control and one climate change (A2 scenario) simulation, have been analysed for Kenya. A domain resolution of 20 km forms the basis of these experiments. These class of models offer much higher resolution than GCMs and, as a result, are of relevance to complex terrain which characterizes Kenya. The regional model was forced by global fields from the FvGCM model.
Regional climate simulation for the East Africa region have thus far been confined to one model and one emission scenario (A2) so the results are very uncertain. To improve the certainty it would need multiple regional models and emission scenarios – a modelling effort which amounts to years more work. Future regional downscaling of the global climate projections for Kenya should be extended to other IPCC GCMs to gain a better sense of the uncertainty associated with the regional climate model projections.
The regional climate projections indicate that the role of sharp mountain range slopes, such as the Great Rift Valley in Kenya, can greatly affect local climate. The IPCC GCMs are based on a large grid resolution (200x200km2) and do not include modifications for altitude. GCM projections are valuable for projections on the large scale as long as they are interpreted with caution, particularly when large contrasts in altitude exist over short distances like in Kenya.
Climate analysis undertaken for this project indicates that Kenya is likely to experience the following climate changes between the late 2020s and 2100:
- Average annual temperature will rise by between 1°C and 5°C, typically 1°C by 2020s and 4°C by 2100.
- Climate is likely to become wetter in both rainy seasons, but particularly in the Short Rains (October to December). Global Climate Models predict increases in northern Kenya (rainfall increases by 40% by the end of the century), whilst a regional model suggests that there may be greater rainfall in the West.
- The rainfall seasonality i.e. Short and Long Rains are likely to remain the same.
- Rainfall events during the wet seasons will become more extreme by 2100. Consequently flood events are likely to increase in frequency and severity.
- Droughts are likely to occur with similar frequency as at present but to increase in severity. This is linked to the increase in temperature.
- The Intergovernmental Panel on Climate Change (IPCC) predict an 18 to 59 cm rise in sea level globally by 2100. One study suggests that 17% of Mombasa’s area could be submerged by a sea-level rise of 30 cm (Orindi and Adwera, 2008).
Existing Projects and Initiatives in Kenya
It will come as a surprise to no-one that there are a lot of projects and initiatives on adaptation to climate change that are being carried out in Kenya. The aim of the Adaptation Layer, and further work in Kenya through a project with Google foundation, is to present some of these initiatives so that’s it’s very easy to see who is doing what in Kenya, and enhance information sharing and collaboration. An example of the sort of project information for Kenya that is available through the Adaptation Layer is shown here
A social network analysis for information needs in Kenya

NetMap results for government, donors etc.
Adaptation to climate change requires using, understanding and interpreting information on climate trends, and projections from climate models. Social Network Analysis helps to map out the links and flows of information between different individuals and organisations, and as such can be used to explore how organisations receive and use climate-related information in Kenya, what the bottle-necks are, and what tools and approaches would be needed to help organisations to feel more informed about climate change adaptation. A workshop in Nairobi in February 2009 used social network analysis to this end, and the initial results from this process are presented here. An example of the type of raw output generated from the workshop is shown in the image to the right.
One idea is to explore the use of the Adaptation Layer as a means of improving information flows on climate change adaptation.
(0) Comments
There is no content